Recently sold › Castro/Upper Market › Saturn St
27 Saturn St
San Francisco, CA 94114
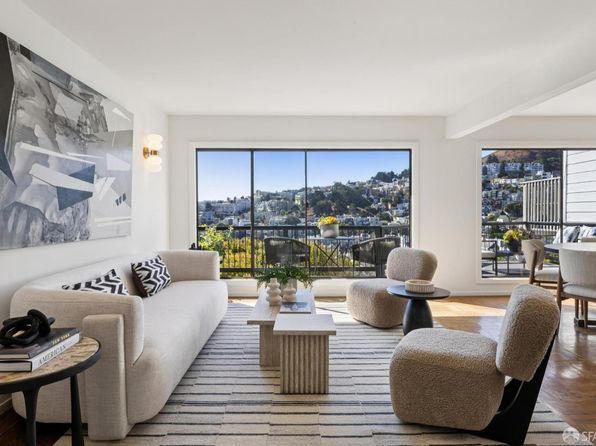
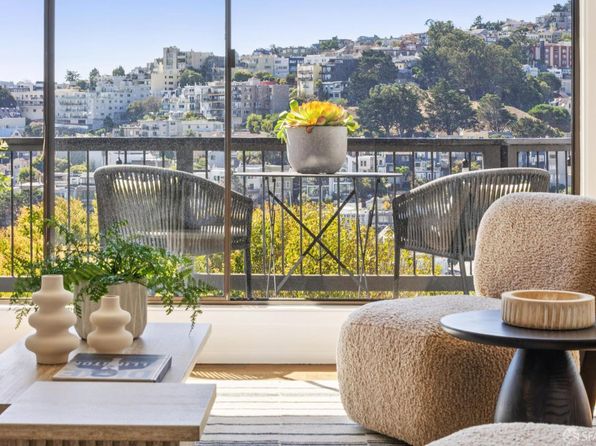
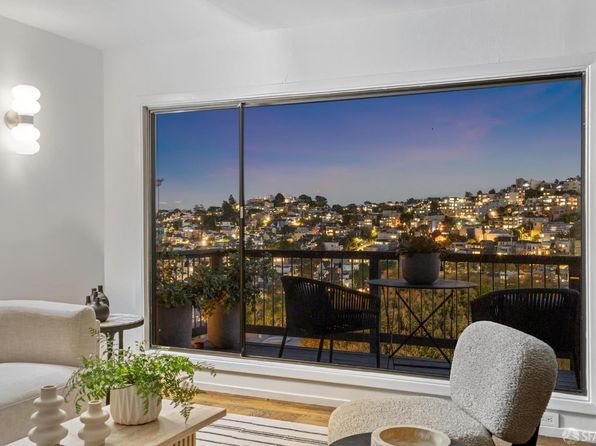
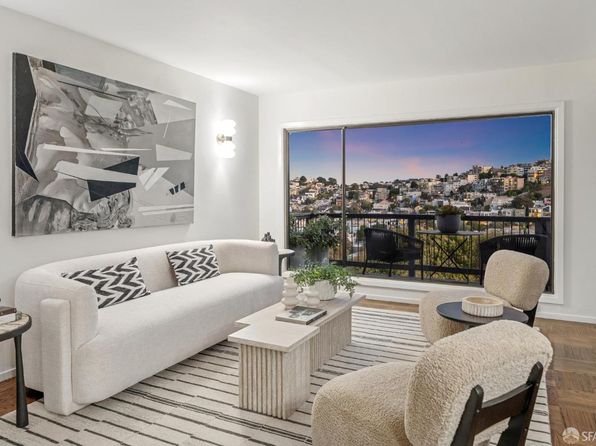
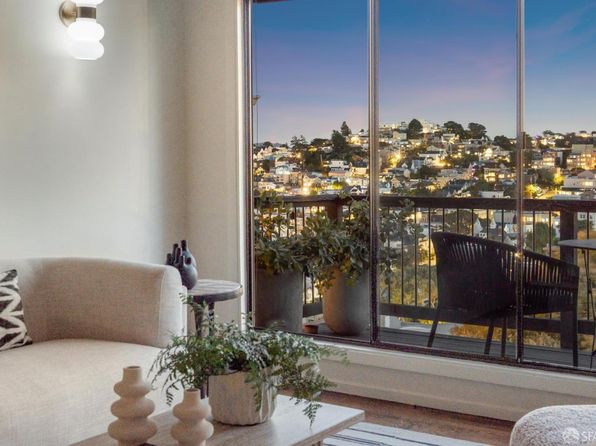
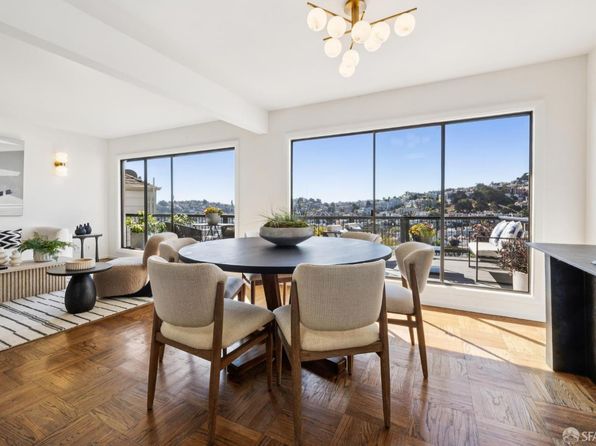
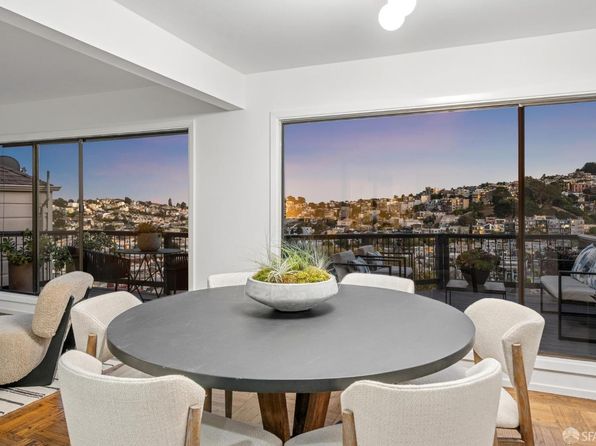
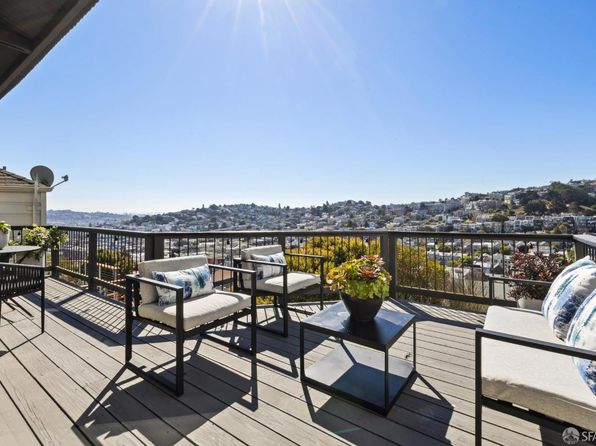
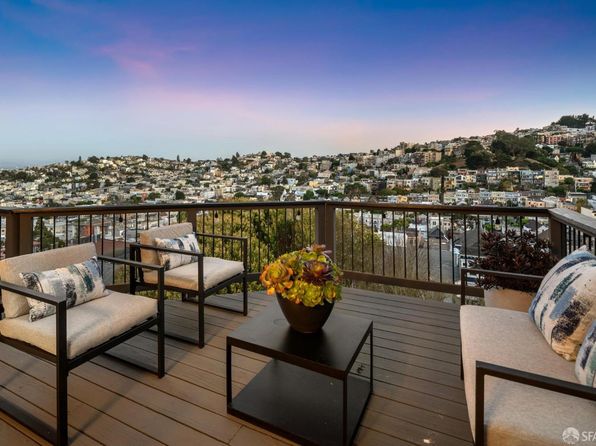
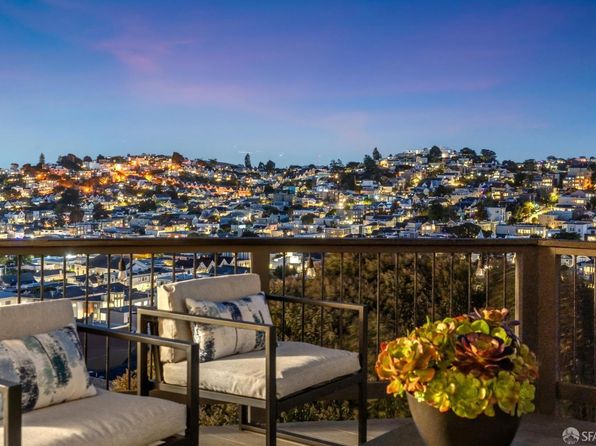
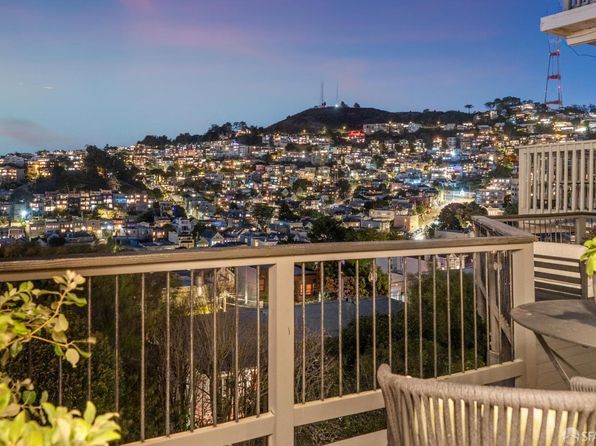
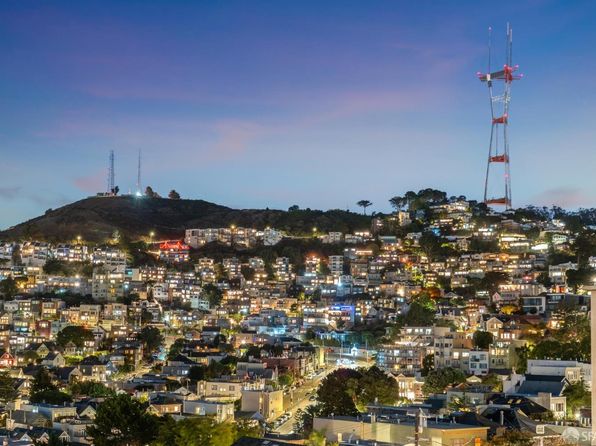
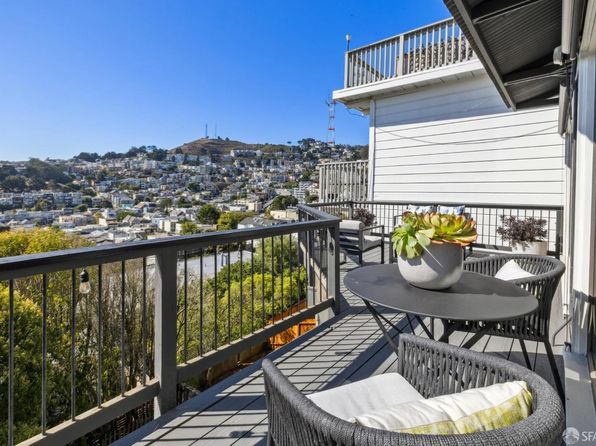
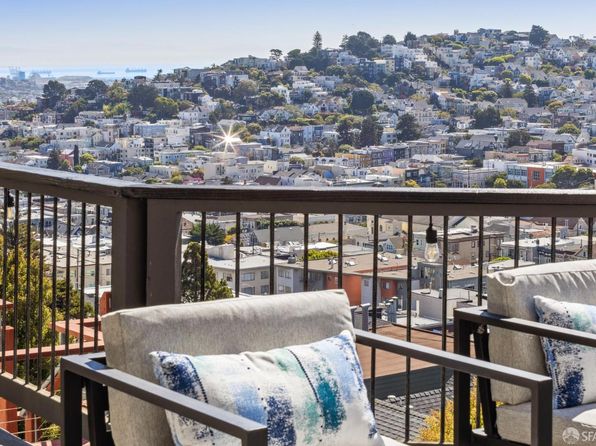
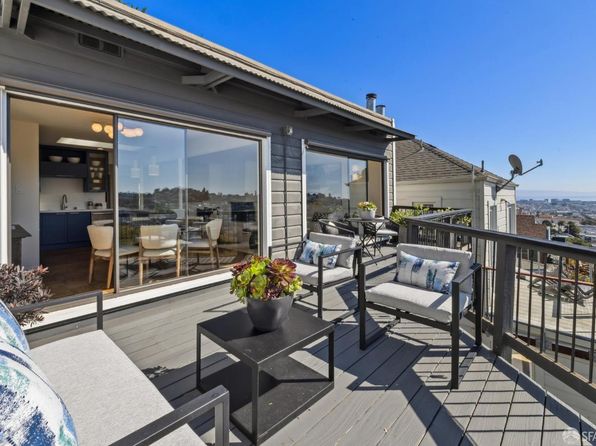
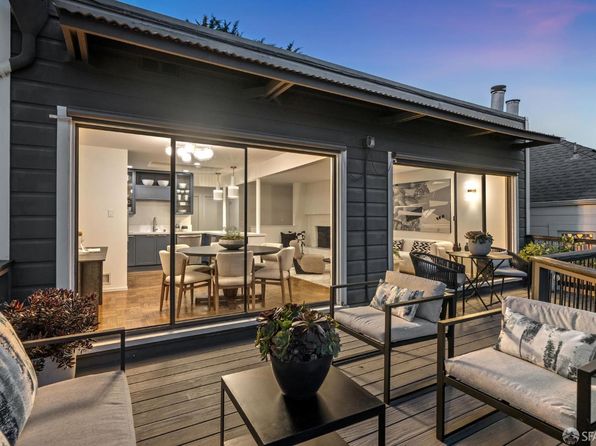
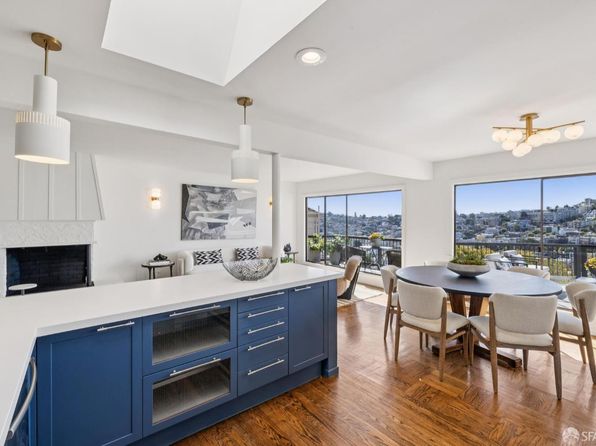
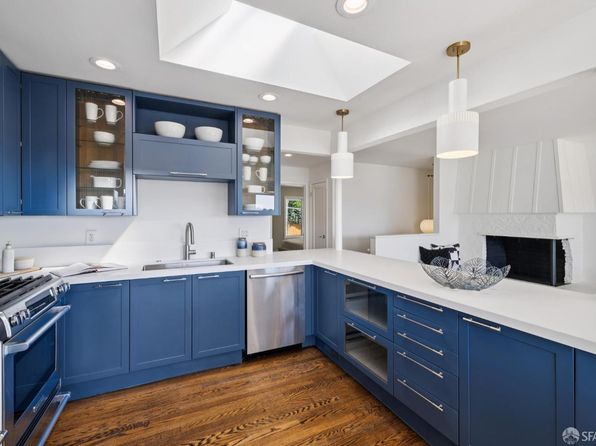
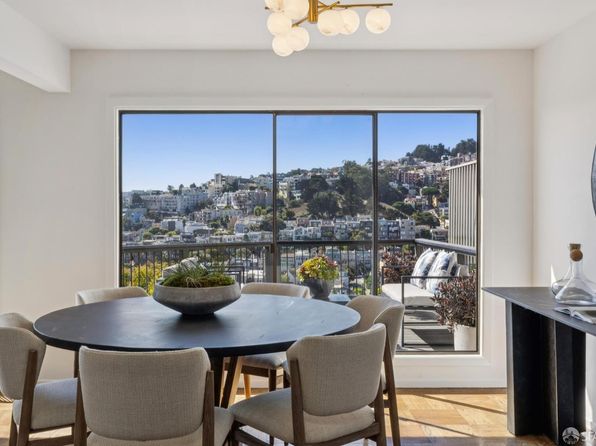
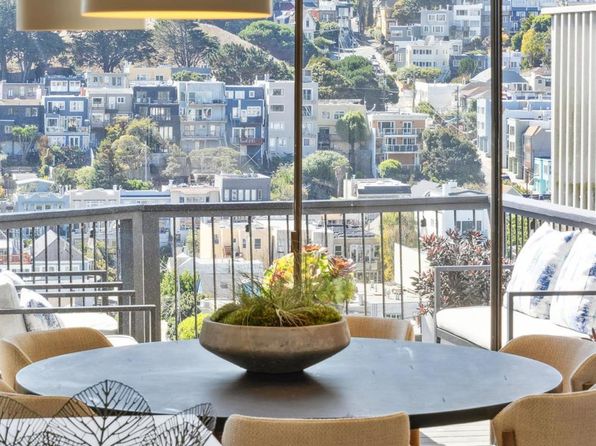
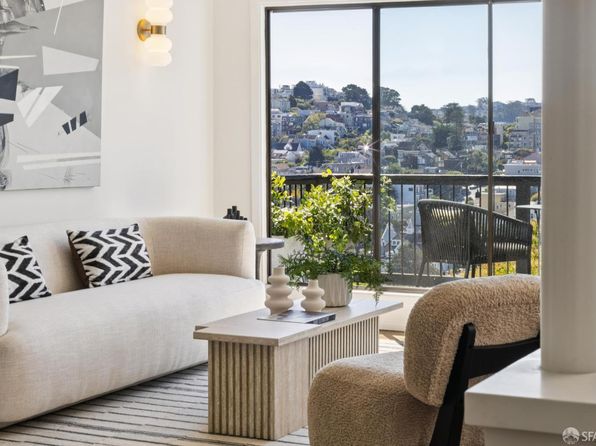
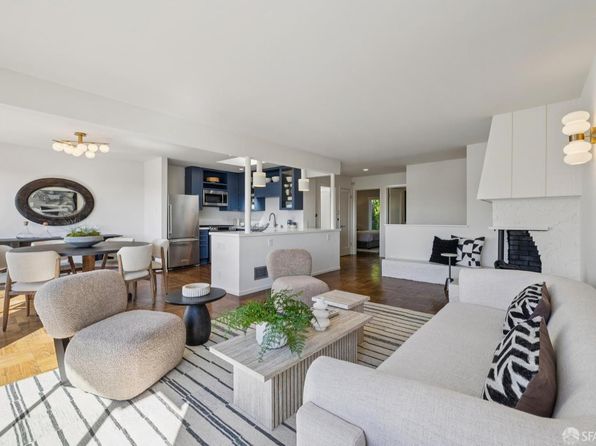
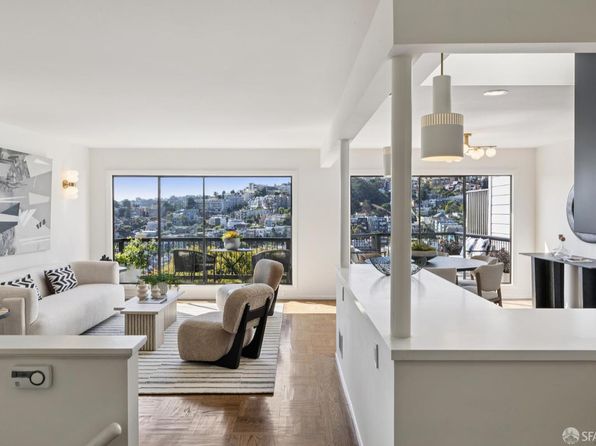
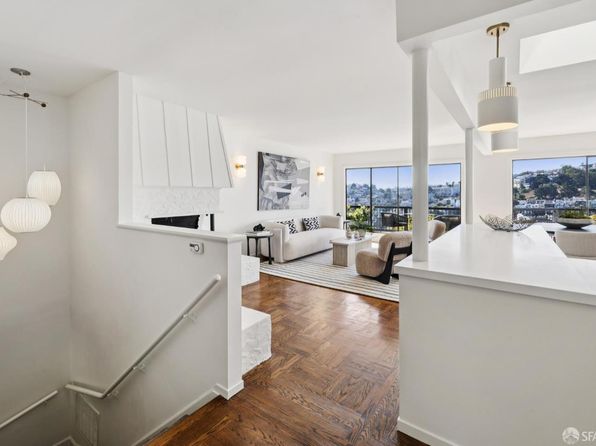
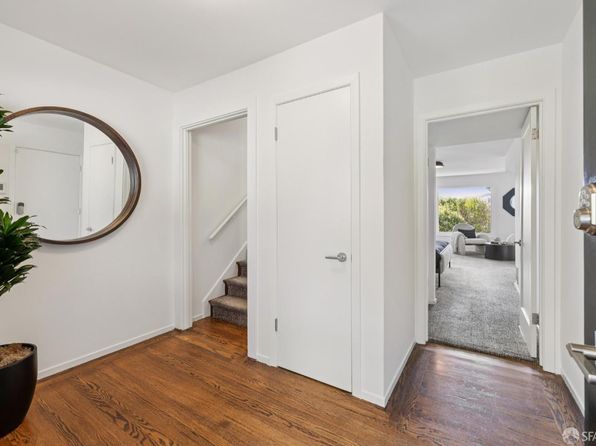
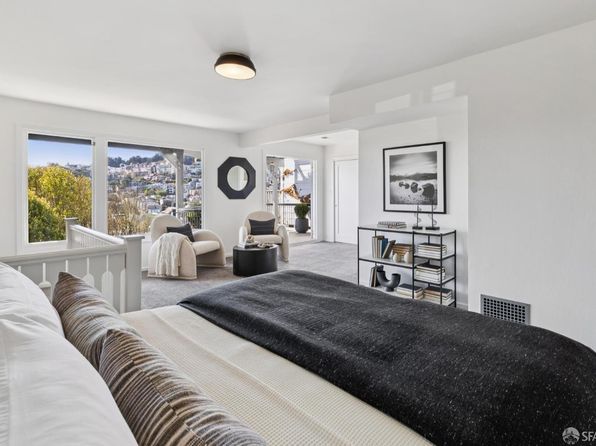
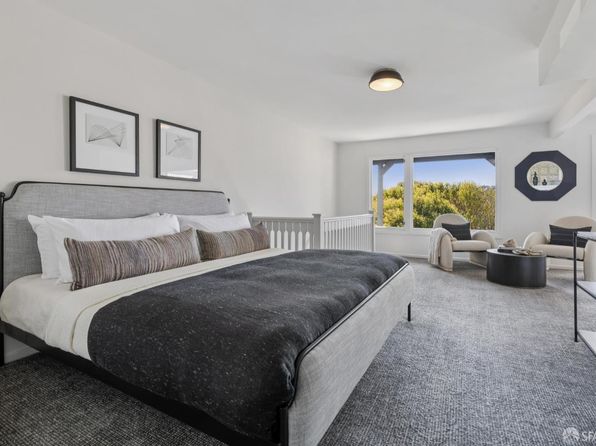
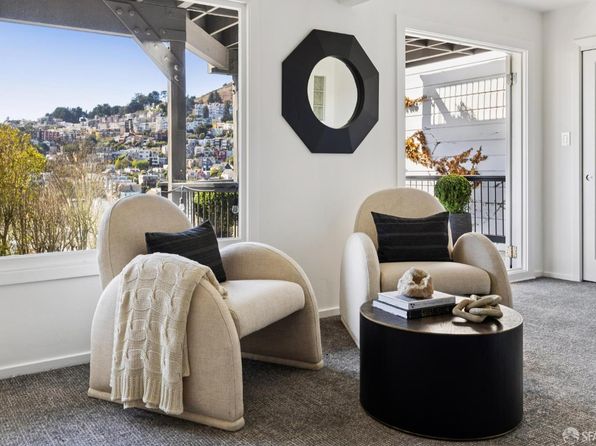
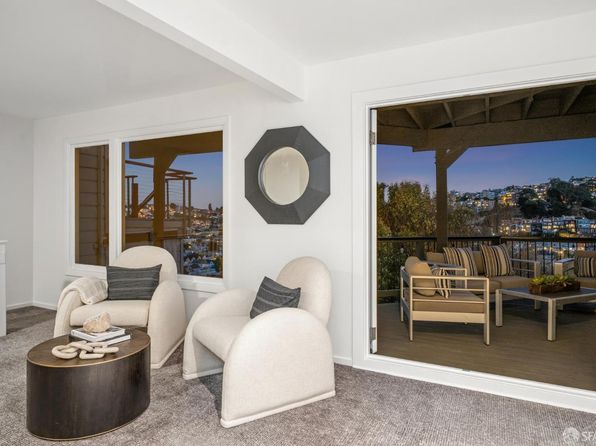
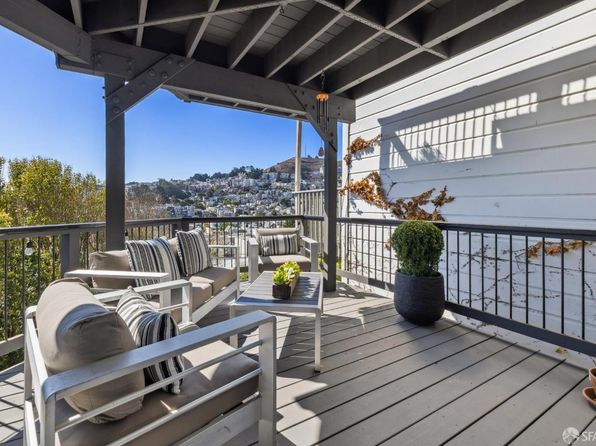
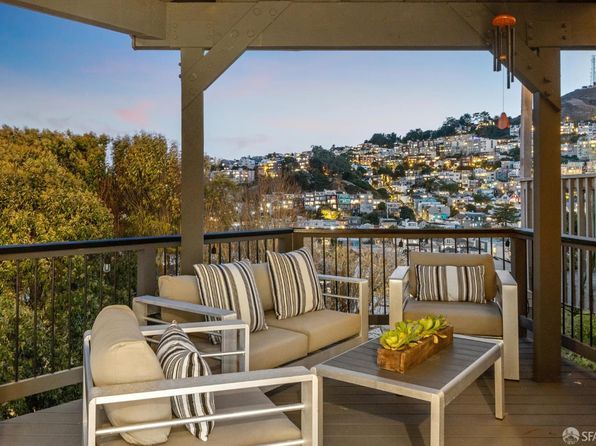
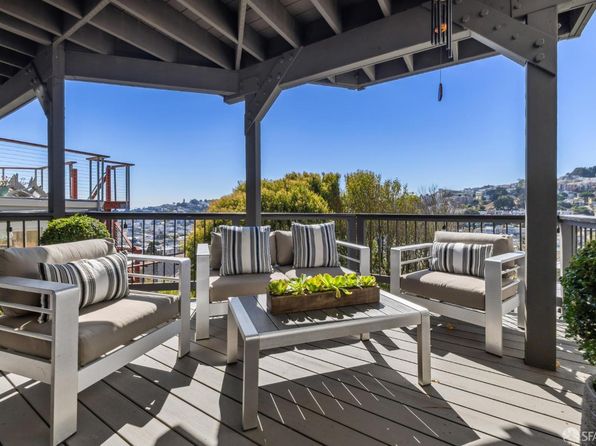
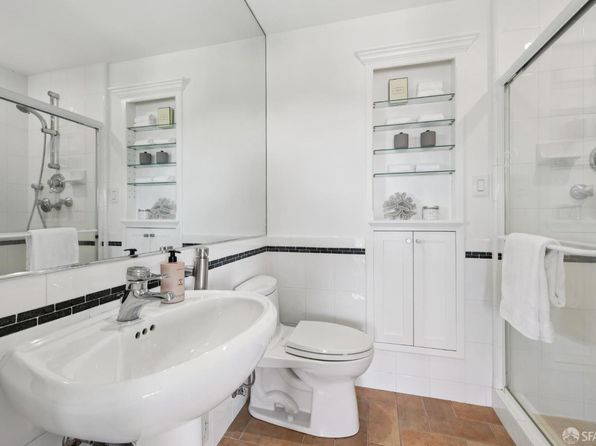
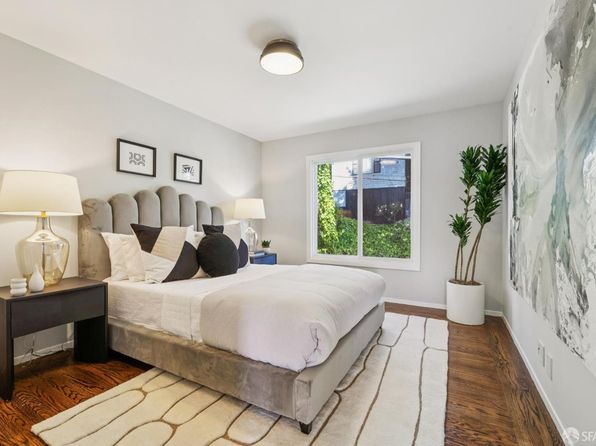
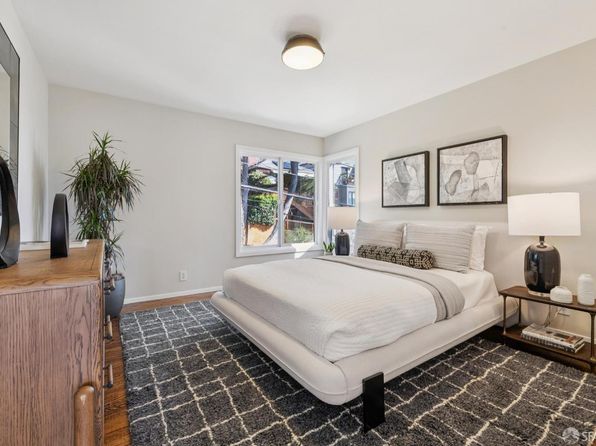
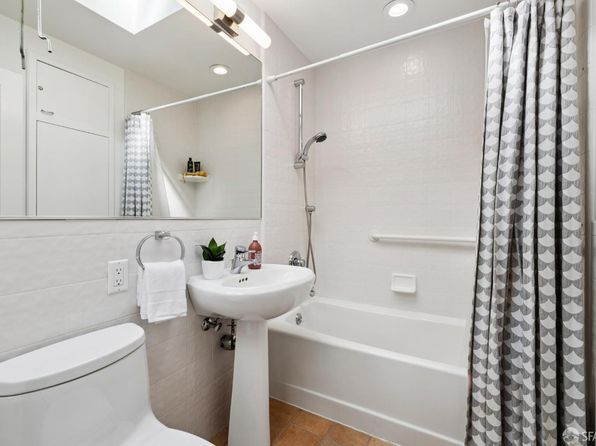
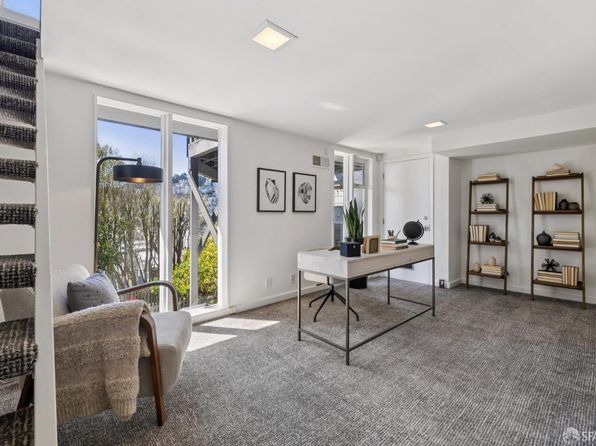
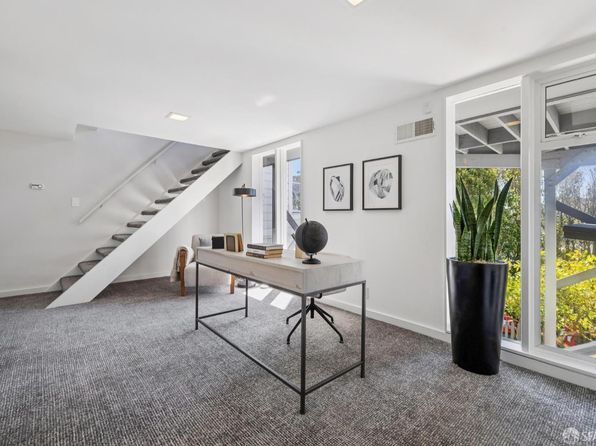
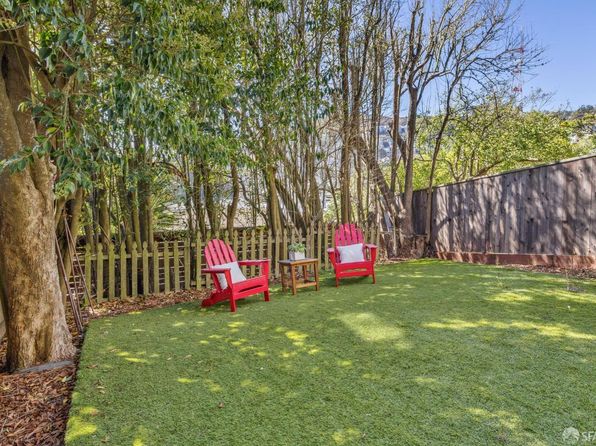
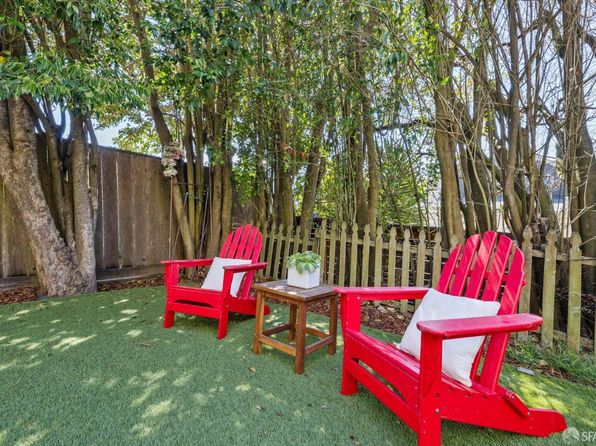
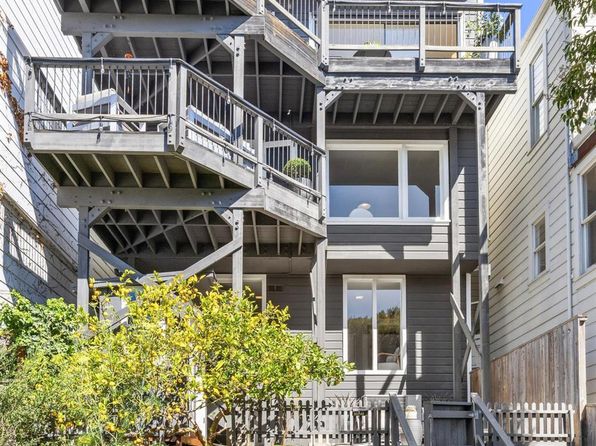
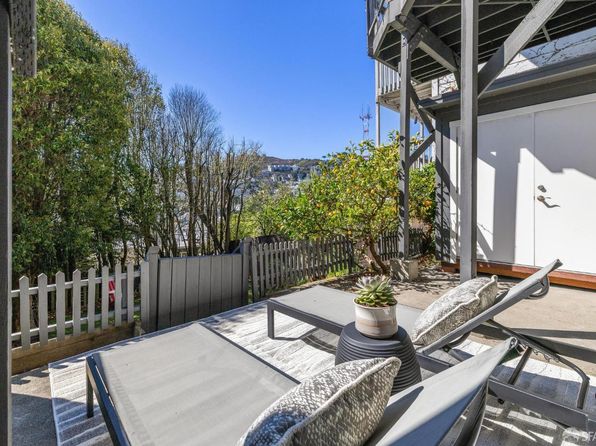
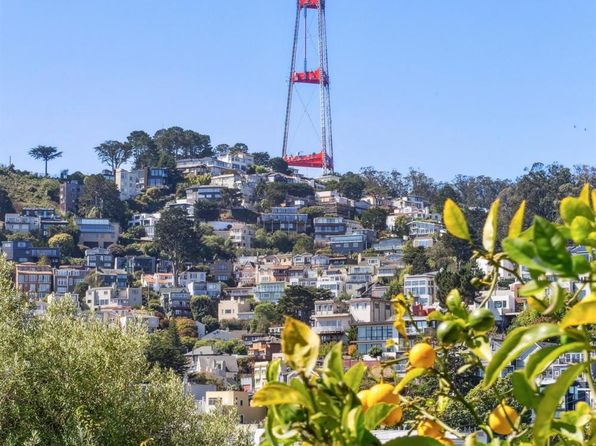
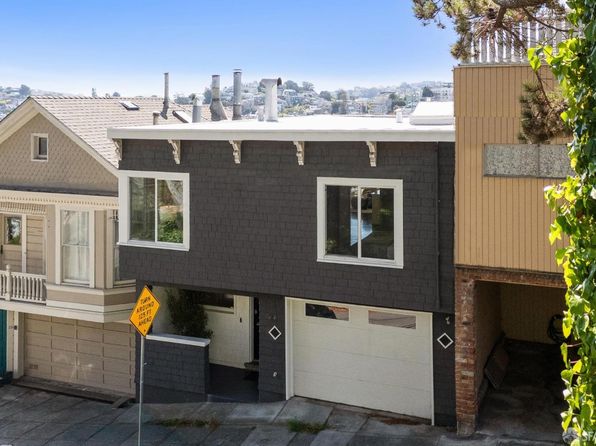
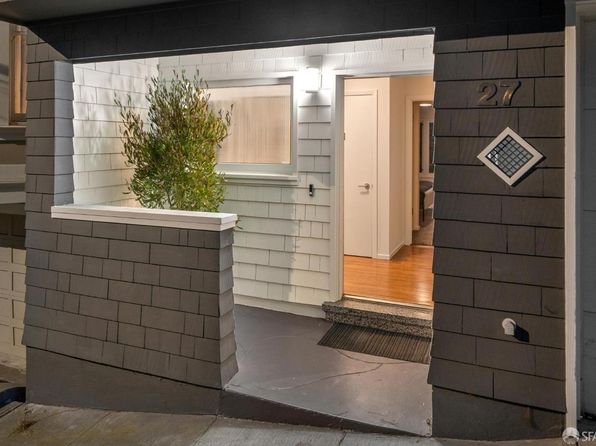
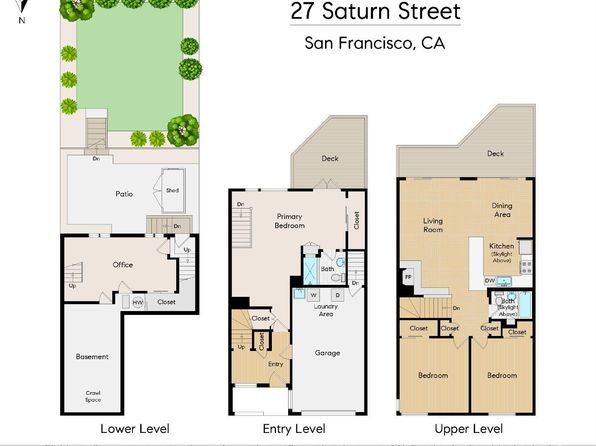
Photos may come from a later listing and may not show the home as it was when it sold.
View all 46 photos
Sold 2025-11-17
$2,600,000
Sale price
- 3 beds
- 2 baths
- 1,985 sqft
- Single-family home
2,187 sqft lot
Estimated sale price$3,157,000
Estimate and comparable salesUpdated 2026-11-02. Prices and availability may have changed.
Sale versus asking
$100,000 below final asking (3.7%)
| Asking price | Price set on | Amount | Sale difference |
|---|---|---|---|
| Final asking | 2025-09-18 | $2,700,000 | $100,000 below asking (3.7%) |
| Original asking | 2025-09-18 | $2,700,000 | $100,000 below asking (3.7%) |
Final asking is the last verified advertised price before this sale went pending or closed. Original asking is the first listed price in that sale’s marketing history, when available.
View price history (13 events)
| Date | Event | Price |
|---|---|---|
| 2025-11-17 | Sold | $2,600,000 |
| 2025-10-22 | Pending sale | $2,700,000 |
| 2025-10-21 | Contingent | $2,700,000 |
| 2025-09-18 | Listed for sale | $2,700,000 |
| 2020-04-16 | Sold | $2,700,000 |
| 2020-03-04 | Pending sale | $1,995,000 |
| 2020-02-21 | Listed for sale | $1,995,000 |
| 2016-09-21 | Sold | $2,021,500 |
| 2016-09-02 | Pending sale | $1,595,000 |
| 2016-08-18 | Listed for sale | $1,595,000 |
| 2012-04-13 | Sold | $1,248,000 |
| 2012-03-10 | Listed for sale | $1,049,000 |
| 1996-10-31 | Sold | $445,000 |
Price history as of 2026-10-28.
34 sales inside 0.35 mi since May 2025. The estimate uses the 33 closest. Click a sale on the map, or untick it below, to leave it out.
Drag the circle or this strip to change the searchEstimated sale price today
Medium confidence
$3,157,000
From 33 comps at a weighted median of $1,591 per sqft.
- Block
- 2646
- Lot
- 048
- Sales
- Oct 2025 to Oct 2026
- Prices adjusted to
- 2026-11-04
- Within
- 0.35 mi
- Sold since
- May 2025
Sale prices versus asking
Similarity-weighted median: 31.5% above final asking.
Middle half: 19.4% above asking to 36.0% above asking. 25 of 33 selected comps have a verified final asking price.
Comparable sales (33)
Every sale inside the circle starts ticked, most similar first. Untick one here, or click it on the map, to leave it out.
| Address | Sold | Price | Final asking | Sale vs. asking | Adj. today | $/sqft | Size | Dist. | Why | |
|---|---|---|---|---|---|---|---|---|---|---|
| 354 Corbett Ave | 2026-09-23 | $2.85M | $2,095,000 | $755,000 above asking (36.0%) | $2.85M | $1,534 | 3bd 3ba 1,858sf | 0.31 mi | similar size, 3 bd, recent | |
| 45 Deming St | 2026-10-22 | $3M | $2,195,000 | $805,000 above asking (36.7%) | $2.87M | $1,478 | 4bd 2ba 1,945sf | 0.27 mi | similar size, recent | |
| 231 Upper Ter Price inferred from public records | 2026-10-28 | $3.58M | $2,995,000 | $580,000 above asking (19.4%) | $3.43M | $1,793 | 2bd 3ba 1,910sf | 0.19 mi | similar size, recent | |
| 135 Corbett Ave | 2026-05-07 | $2.6M | $1,950,000 | $650,000 above asking (33.3%) | $2.72M | $1,662 | 3bd 2ba 1,638sf | 0.07 mi | 3 bd | |
| 132 Corbett Ave | 2026-05-21 | $3.2M | $2,495,000 | $705,000 above asking (28.3%) | $3.35M | $1,591 | 4bd 3ba 2,107sf | 0.06 mi | similar size | |
| 447 Buena Vista Ave E Price inferred from public records | 2026-07-08 | $6.5M | — | — | $7M | $3,239 | 4bd 5ba 2,160sf | 0.23 mi | similar size | |
| 80 Diamond St | 2026-04-22 | $3.83M | $2,995,000 | $833,000 above asking (27.8%) | $3.97M | $1,899 | 3bd 3ba 2,090sf | 0.24 mi | similar size, 3 bd | |
| 4431 19th St | 2026-04-24 | $2.6M | $2,500,000 | $100,000 above asking (4.0%) | $2.7M | $1,318 | 3bd 2ba 2,046sf | 0.29 mi | similar size, 3 bd | |
| 4799 19th St | 2026-04-06 | $2.23M | $1,785,000 | $440,000 above asking (24.6%) | $2.31M | $1,268 | 4bd 1ba 1,819sf | 0.29 mi | similar size | |
| 227 Roosevelt Way | 2026-09-11 | $2.25M | No asking price | — | $2.25M | $1,380 | 1ba 1,630sf | 0.26 mi | recent | |
| 408 Roosevelt Way | 2026-06-10 | $3.48M | $2,098,000 | $1,377,000 above asking (65.6%) | $3.64M | $2,415 | 3bd 3ba 1,506sf | 0.19 mi | 3 bd | |
| 32 Carson St | 2026-04-17 | $3.4M | $2,585,000 | $815,000 above asking (31.5%) | $3.53M | $2,111 | 3bd 3ba 1,670sf | 0.29 mi | 3 bd | |
| 4075 17th St Price inferred from public records | 2026-04-23 | $2.47M | — | — | $2.56M | $1,096 | 4bd 3ba 2,336sf | 0.25 mi | ||
| 316 Douglass St | 2026-04-09 | $4.2M | $3,695,000 | $505,000 above asking (13.7%) | $4.35M | $1,799 | 3bd 4ba 2,420sf | 0.29 mi | 3 bd | |
| 376 Corbett Ave | 2025-11-20 | $2.13M | $1,695,000 | $430,000 above asking (25.4%) | $2.49M | $1,287 | 3bd 3ba 1,935sf | 0.34 mi | similar size, 3 bd | |
| 187 Upper Ter Price inferred from public records | 2026-09-24 | $4.76M | — | — | $4.76M | $1,614 | 4bd 2ba 2,950sf | 0.19 mi | recent | |
| 359 Douglass St | 2026-03-11 | $2.06M | $1,195,000 | $860,000 above asking (72.0%) | $2.16M | $1,297 | 2bd 1ba 1,667sf | 0.34 mi | ||
| 1278 Clayton St | 2025-12-09 | $3.5M | No asking price | — | $4.17M | $1,776 | 3bd 4ba 2,350sf | 0.29 mi | 3 bd | |
| 4789 19th St | 2026-05-29 | $2.52M | $1,995,000 | $530,000 above asking (26.6%) | $2.64M | $1,808 | 2bd 2ba 1,463sf | 0.29 mi | ||
| 141 Lower Ter Price inferred from public records | 2026-01-02 | $3.65M | — | — | $4.32M | $1,608 | 4bd 4ba 2,685sf | 0.07 mi | ||
| 221 Danvers St | 2026-07-14 | $4.55M | $3,995,000 | $555,000 above asking (13.9%) | $4.9M | $1,682 | 3bd 4ba 2,912sf | 0.25 mi | 3 bd | |
| 1002 Clayton St | 2026-10-16 | $5.4M | $3,595,000 | $1,805,000 above asking (50.2%) | $5.17M | $1,741 | 4bd 4ba 2,972sf | 0.32 mi | recent | |
| 4822 19th St | 2025-12-17 | $3.48M | $3,475,000 | At asking | $4.14M | $1,451 | 4bd 5ba 2,855sf | 0.26 mi | ||
| 4532 17th St | 2026-06-12 | $3.35M | $2,995,000 cut from $3.69M | $355,000 above asking (11.9%) | $3.51M | $1,175 | 3bd 3ba 2,985sf | 0.26 mi | 3 bd | |
| 4376 17th St | 2026-04-15 | $3.4M | $3,295,000 | $105,000 above asking (3.2%) | $3.53M | $1,158 | 3bd 4ba 3,045sf | 0.07 mi | 3 bd | |
| 3775 16th St | 2025-10-29 | $2.42M | $1,995,000 | $425,000 above asking (21.3%) | $2.78M | $2,149 | 4bd 2ba 1,295sf | 0.26 mi | ||
| 1550 Masonic Ave | 2026-06-12 | $3M | $1,995,000 | $1,005,000 above asking (50.4%) | $3.14M | $2,673 | 2bd 1ba 1,175sf | 0.27 mi | ||
| 35 Hattie Street | 2025-11-25 | $2.13M | $2,190,000 cut from $2.9M | $63,400 below asking (2.9%) | $2.49M | $990 | 5bd 5ba 2,518sf | 0.10 mi | ||
| 10 Deming St | 2026-07-28 | $5.9M | $4,450,000 | $1,450,000 above asking (32.6%) | $6.35M | $1,977 | 4bd 4ba 3,211sf | 0.24 mi | ||
| 980 Ashbury St | 2026-07-09 | $4.28M | $3,950,000 | $325,000 above asking (8.2%) | $4.6M | $1,411 | 4bd 4ba 3,260sf | 0.27 mi | ||
| 4 Ord Ct | 2026-03-13 | $1.7M | $1,750,000 | $50,000 below asking (2.9%) | $1.79M | $1,529 | 2bd 2ba 1,170sf | 0.10 mi | ||
| 4555 19th St | 2026-06-18 | $1.85M | No asking price | — | $1.94M | $1,696 | 2bd 1ba 1,142sf | 0.27 mi | ||
| 49 Eagle St | 2025-12-11 | $5.63M | No asking price | — | $6.71M | $2,039 | 4bd 5ba 3,290sf | 0.32 mi |
What other buyers offered
No one has reported a losing offer on this home yet. Lost a bid here? Sign in to add yours, so the next buyer sees how far over asking it really went.
This home's sale history
- 2025-11-17: $2,600,000 — $100,000 below final asking (3.7%) ($2,700,000) (closing price, high confidence) Sale details
- 2016-09-21: $2,021,319 (price inferred from public records, high confidence)
Today's estimate uses the home's latest facts. It does not say what the home was worth at these sales.